
Abstract
Public debate about artificial intelligence (AI) is dominated by model architectures and benchmark scores, yet the marginal constraint on AI expansion is increasingly located upstream, in the industrial, energy, and materials base that computation depends on. We argue that AI capacity is governed less by algorithmic progress than by upstream industrial physics, and formalise this claim as the Industrial Bottleneck Cascade (IBC): a framework in which constraints originating in resource extraction and materials propagate — with rising lead times and falling substitutability — through conversion and deployment layers to the point of compute. We test the IBC framework's predictions in a single, data-rich validation case: Brazil, a country with substantial endowments in the earliest links of the chain. Global data-centre electricity consumption is projected by the International Energy Agency to more than double by 2030, and global semiconductor sales grew 25.6% in 2025. In Brazil, transmission-grid connection requests from data-centre projects far outpaced operating load in late 2025, consistent with the framework's prediction that deployment-stage demand will outrun conversion-stage capacity. Classifying Brazil's position across thirteen chain links, we find the structurally bimodal pattern the framework predicts: strong domestic capability in extraction and construction, alongside critical import dependence in leading-edge semiconductor fabrication, hyperscale cloud platforms, and frontier foundation models — consistent with the reprimarisation dynamic documented in the Brazilian global-value-chain literature. We discuss the limits of physical-infrastructure hosting as a development strategy and argue that the next phase of AI competition will increasingly depend on countries' ability to control energy, materials, and industrial infrastructure rather than compute architectures alone.
Keywords: industrial bottleneck cascade; artificial intelligence infrastructure; global value chains; semiconductors; data centres; energy demand; technological dependency; industrial policy; Brazil
Introduction
Since 2023, public and policy discussion of artificial intelligence has centred overwhelmingly on model capability: parameter counts, benchmark performance, and the competitive positioning of firms developing foundation models. A parallel but comparatively under-analysed shift has occurred on the supply side. Large technology firms have redirected a growing share of capital expenditure away from software development alone and toward physical assets: land, data-centre shells, electrical connections, cooling systems, and long-lead-time equipment such as power transformers. This shift reflects a basic economic fact that the AI-policy literature has been slower to formalise than the energy and industrial-economics literatures: a graphics processing unit (GPU) cluster is not a self-contained productive asset. It is the terminal node of a chain that begins in mineral extraction and passes through metallurgy, advanced materials, semiconductor fabrication, electrical equipment manufacturing, and grid infrastructure before any inference or training workload can run. In this sense, AI does not begin in software; it ends there — and the central claim of this Perspective is that digital intelligence is, and will remain, governed by the physics and economics of the industrial base beneath it.
This reframing matters for two reasons. First, several of the links immediately upstream of compute — high-voltage transformers, grid connection queues, advanced-node semiconductor fabrication capacity, and high-bandwidth memory — already function as near-term constraints on how quickly AI infrastructure can scale, largely independent of algorithmic progress1,2. Second, because these upstream links are themselves globally concentrated and geopolitically contested, the distribution of AI-related economic value across countries is unlikely to track the distribution of AI-related physical infrastructure. A country can host extensive data-centre capacity, supply the metals and electrical equipment that build it, and still capture a small share of the value generated by the models that run inside it.
This second point connects the AI-infrastructure literature to a longer-standing body of research on global value chains (GVCs), technological catch-up, and reprimarisation in middle-income economies. Work on the semiconductor GVC has shown how geopolitically motivated export controls reshape the distribution of chip-manufacturing capability between incumbent and catching-up economies3, while the economic-complexity literature has shown that a country's position in the product space — not merely its participation in trade — predicts its subsequent development trajectory4. For Brazil specifically, industrial-economics and trade analyses point to a reprimarisation of the export basket over the past two decades, with the share of mineral and agricultural products in total exports rising even as the country's ranking on standard economic-complexity indices has not improved5,6. Whether this same pattern reproduces itself in the emerging AI-infrastructure buildout — where Brazil is simultaneously a leading global supplier of iron ore and niobium and a large host market for hyperscale data centres — is, to our knowledge, not yet documented with primary, dated evidence.
We address this gap by developing a general framework — the Industrial Bottleneck Cascade (IBC) — for how constraints originating upstream in the chain propagate downstream to compute, and by testing that framework against a single, data-rich validation case. Two linked aims follow. First, we characterise the physical, energy, and materials base of global AI infrastructure using the most recent institutional data available (International Energy Agency [IEA] energy statistics; Semiconductor Industry Association [SIA]/World Semiconductor Trade Statistics [WSTS] market data) and use it to specify the IBC framework's stages and testable predictions. Second, we use Brazil — not as the subject of this Perspective, but as an evidence-rich country in which the framework's predictions can be checked against country-level trade, mining, energy, and regulatory data — to test whether its participation in the chain reproduces the physical-strength/value-capture-weakness asymmetry the framework predicts, and whether that asymmetry is consistent with the broader reprimarisation pattern documented in the Brazilian GVC literature. A country in which this asymmetry did not appear, despite comparable physical endowments, would count as evidence against the framework; the case is chosen for evidentiary density, not for its conclusion being foregone. We report our findings as a Perspective rather than a systematic review: the evidentiary base was assembled through targeted, source-hierarchy-prioritised search (Methods) rather than a pre-registered PRISMA protocol, and we flag this scope explicitly so that readers can calibrate the weight the synthesis can bear.
Results
Architecture beneath AI compute
Figure 1 summarises the structural logic used throughout this Perspective: AI compute sits at the end of a chain that groups, for analytical purposes, into six broad layers — resource extraction; materials and metallurgy; electro-industrial equipment; compute hardware; digital infrastructure (data centres and cloud); and the AI layer itself (foundation models and applications). This grouping is a structuring device, not a measured index: it follows the qualitative link-by-link description developed in Methods, and adjacent links are grouped where they share similar input dependence and value-added intensity.
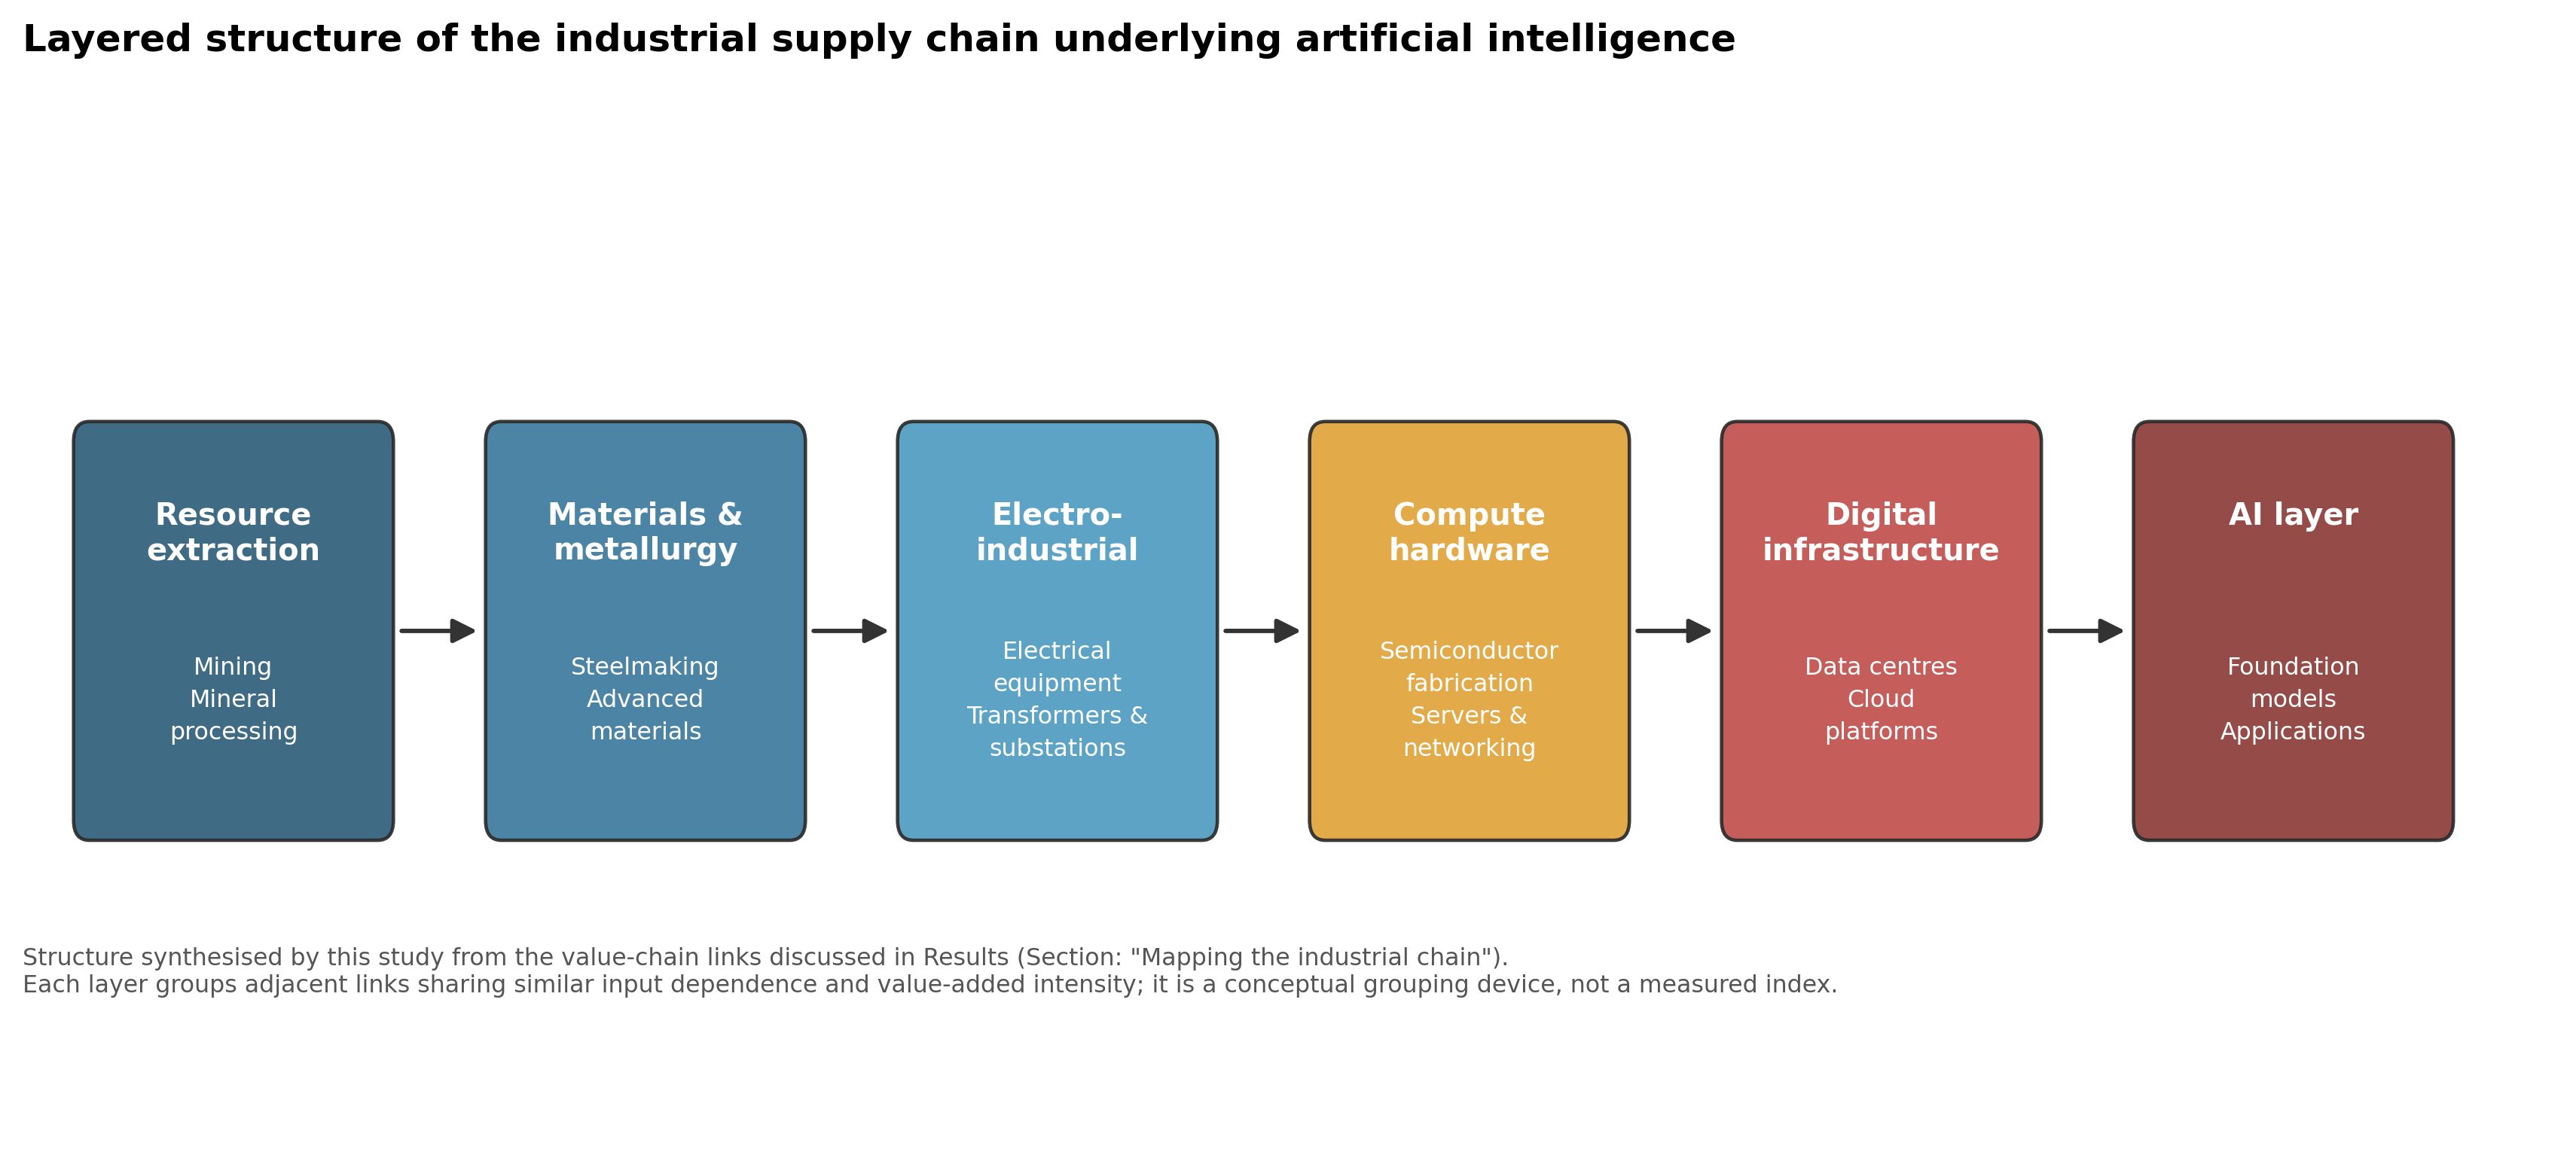
Six-layer grouping of the AI supply chain used as an organising framework throughout this Perspective, synthesised from the link-level description in Methods.
This is a conceptual structuring device, not a quantitatively weighted or measured index.
Anatomy of a data-centre build
The six layers in Fig. 1 can obscure how much distinct, long-lead-time engineering sits behind a single data-centre build. Before a rack draws power, a project typically requires a dedicated high-voltage substation and grid interconnection, permitted and sized years ahead of construction; power transformers carrying multi-year global order backlogs, specified in redundant (commonly N+1 or 2N) configurations because a transformer failure without spare capacity can take a facility fully offline; protection and switchgear systems — relays, breakers, and control panels engineered to isolate a fault within milliseconds and certified against the local utility's specific grid code; medium- and low-voltage distribution panels feeding uninterruptible power supplies and, downstream, the racks themselves; cooling sized for the thermal density of the compute layer, from conventional chilled-water and computer-room air-handling units to, increasingly, direct-liquid or immersion cooling for high-density AI racks; an industrial water supply and treatment system to support that cooling load, itself a binding permitting and environmental-licensing constraint in water-stressed regions; tens to hundreds of kilometres of power and structured cabling, copper- and fibre-intensive and subject to the same commodity cycles as the rest of the chain; structural steel and reinforced-concrete civil works engineered for the floor loading of high-density racks and the site's seismic or wind code; and a logistics chain capable of moving oversized, heavy equipment — a single power transformer can weigh over 100 tonnes — from fabrication site to a location that, in emerging AI-infrastructure markets, frequently lacks port, rail, or road capacity built for that class of cargo.
None of this is specific to Brazil; it is generic to any hyperscale build anywhere in the world, and every item in this list is a physical, permitted, engineered asset with its own lead time, supplier concentration, and failure mode, distinct from the software running on top of it. We describe it here not as an exhaustive engineering specification, which is outside the scope of a Perspective, but to make concrete what "physical infrastructure" denotes throughout this paper: not a metaphor for constraint, but a literal, multi-year construction and procurement programme that the AI-policy and AI-benchmark literatures have, to date, largely treated as background.
The Industrial Bottleneck Cascade
We propose the Industrial Bottleneck Cascade (IBC) as a general framework for how physical constraints on AI capacity originate and propagate. The IBC models the six-layer structure in Fig. 1 as three functional stages. The extraction stage (resource extraction; materials and metallurgy) supplies inputs that are geologically concentrated but, for any given input, substitutable across multiple national suppliers over multi-year horizons. The conversion stage (electro-industrial equipment; compute hardware) transforms these inputs into engineered capacity — transformers, fabrication lines, memory — under conditions of high capital intensity, long lead times, and a small number of globally qualified suppliers, which sharply reduces substitutability relative to the extraction stage. The deployment stage (digital infrastructure; the AI layer itself) consumes conversion-stage capacity at a pace set by capital markets and model-scaling ambitions that is largely decoupled from, and typically faster than, the rate at which conversion-stage capacity can expand.
The framework generates three testable predictions, each addressed with evidence below. First, binding constraints on AI expansion should concentrate in the conversion stage rather than the extraction or deployment stages, because that is where substitutability is lowest and lead times longest (tested against energy and semiconductor data, below). Second, a country's economic value capture across the chain should track its position in the conversion stage specifically, not its aggregate physical participation, so that strong extraction-stage endowments need not translate into strong value capture (tested against Brazil's chain-position classification, below). Third, deployment-stage demand growth should systematically outrun conversion-stage capacity growth wherever both are separately observable, producing measurable pipeline-to-delivered-capacity gaps (tested against Brazil's grid-connection data, below). A case in which value capture instead tracked extraction-stage endowment, or in which pipeline and delivered capacity moved together, would count as evidence against the framework rather than for it.
Electricity demand is the most extensively documented binding constraint in this chain. According to the IEA's Energy and AI report, global data-centre electricity consumption reached approximately 415 TWh in 2024, about 1.5% of world electricity consumption, and has grown at roughly 12% per year since 2017 — more than four times the growth rate of total electricity consumption1. Under the IEA's Base Case, this figure is projected to more than double to approximately 945 TWh by 2030, a level exceeding Japan's current total electricity consumption1. An updated IEA assessment released in late 2025 revises the 2025 baseline upward to approximately 485 TWh, with the 2030 projection revised to approximately 950 TWh — materially the same trajectory obtained by extending, rather than revising downward, the original estimate2. Figure 2 plots this trajectory.
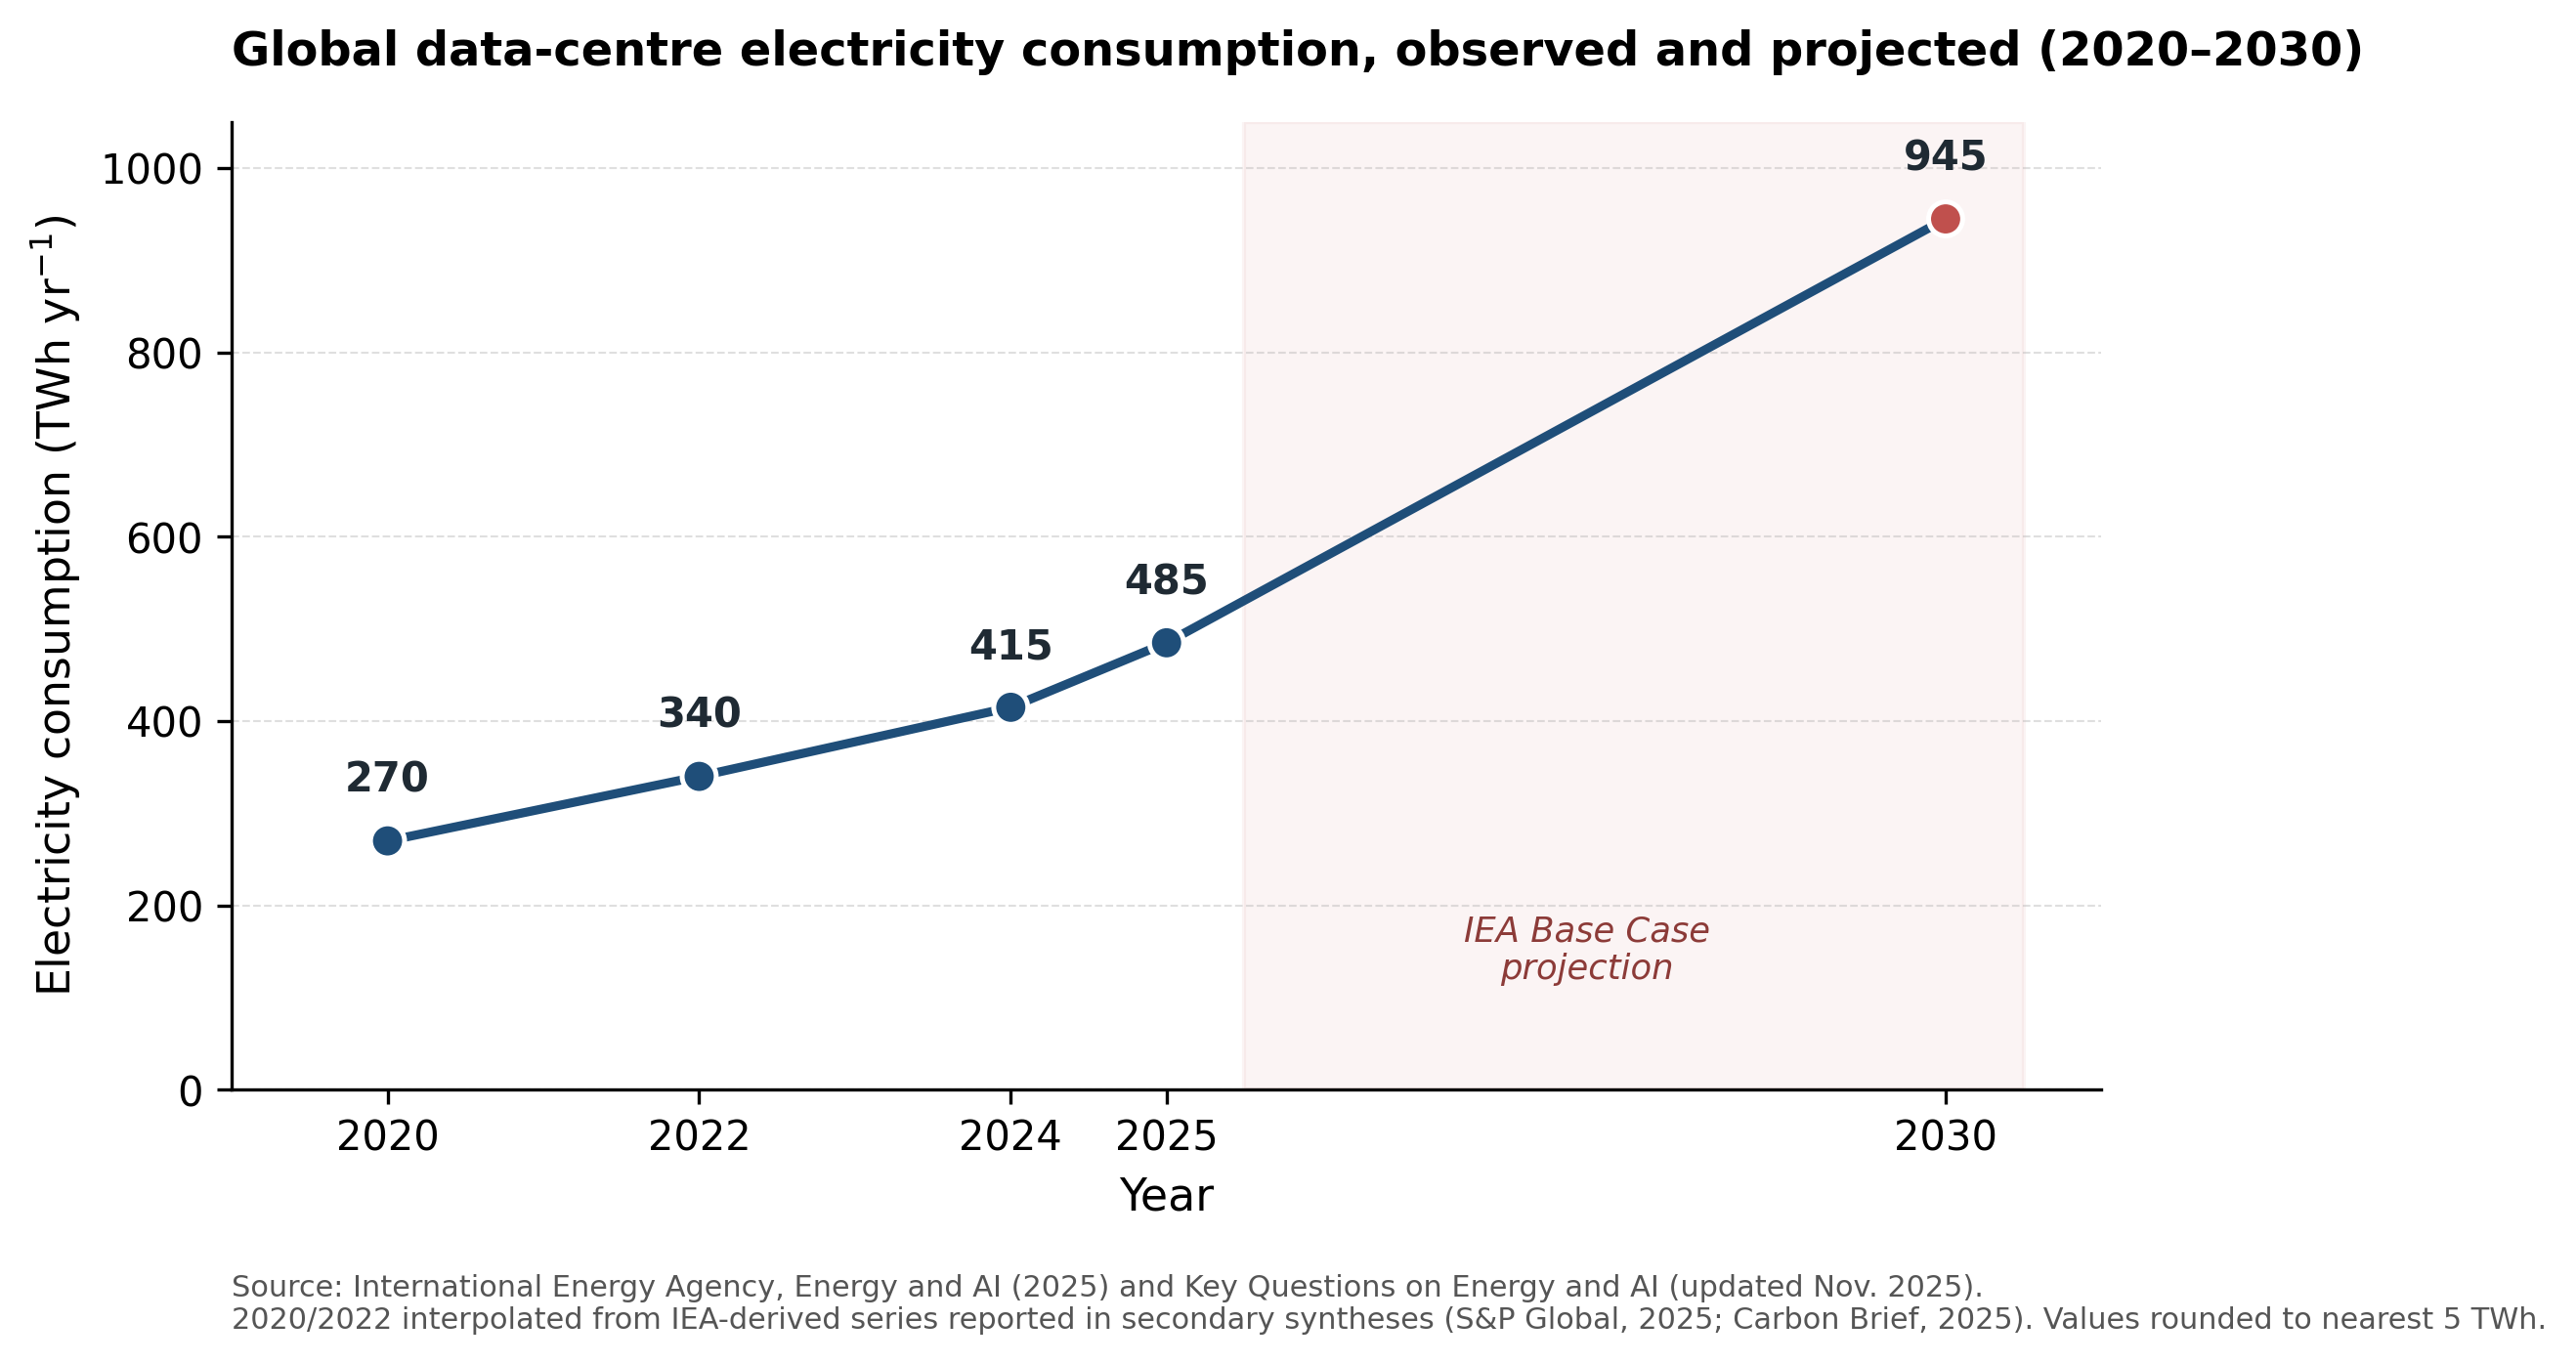
Source: International Energy Agency, Energy and AI (2025)¹ and Key Questions on Energy and AI (updated Nov. 2025)².
2020/2022 points interpolated from IEA-derived series reported in secondary syntheses (S&P Global, 2025; Carbon Brief, 2025); shown for trend context only.
The shaded region marks the IEA Base Case projection period (2026–2030); values before 2025 are IEA-reported estimates, not model projections.
This trajectory is a global aggregate and is not uniformly distributed: the United States and China together account for the large majority of both current consumption and projected growth, and AI-focused data centres draw electricity at a rate comparable to power-intensive industrial facilities such as aluminium smelters, while being far more geographically concentrated within a small number of regional clusters. This concentration is itself consequential for the grid-connection bottlenecks discussed below, both globally and in the Brazilian case.
Semiconductors: the chain's bottleneck
Global semiconductor sales — the input most consistently identified in the literature as the chain's binding technological constraint — grew from US$630.5 billion in 2024 to US$791.7 billion in 2025, an increase of 25.6%, driven disproportionately by logic and memory products used in AI accelerators and data-centre infrastructure7. Figure 3 shows this trajectory alongside the World Semiconductor Trade Statistics (WSTS) autumn-2025 consensus forecast for 2026, which is shown separately as a forecast rather than an outturn.
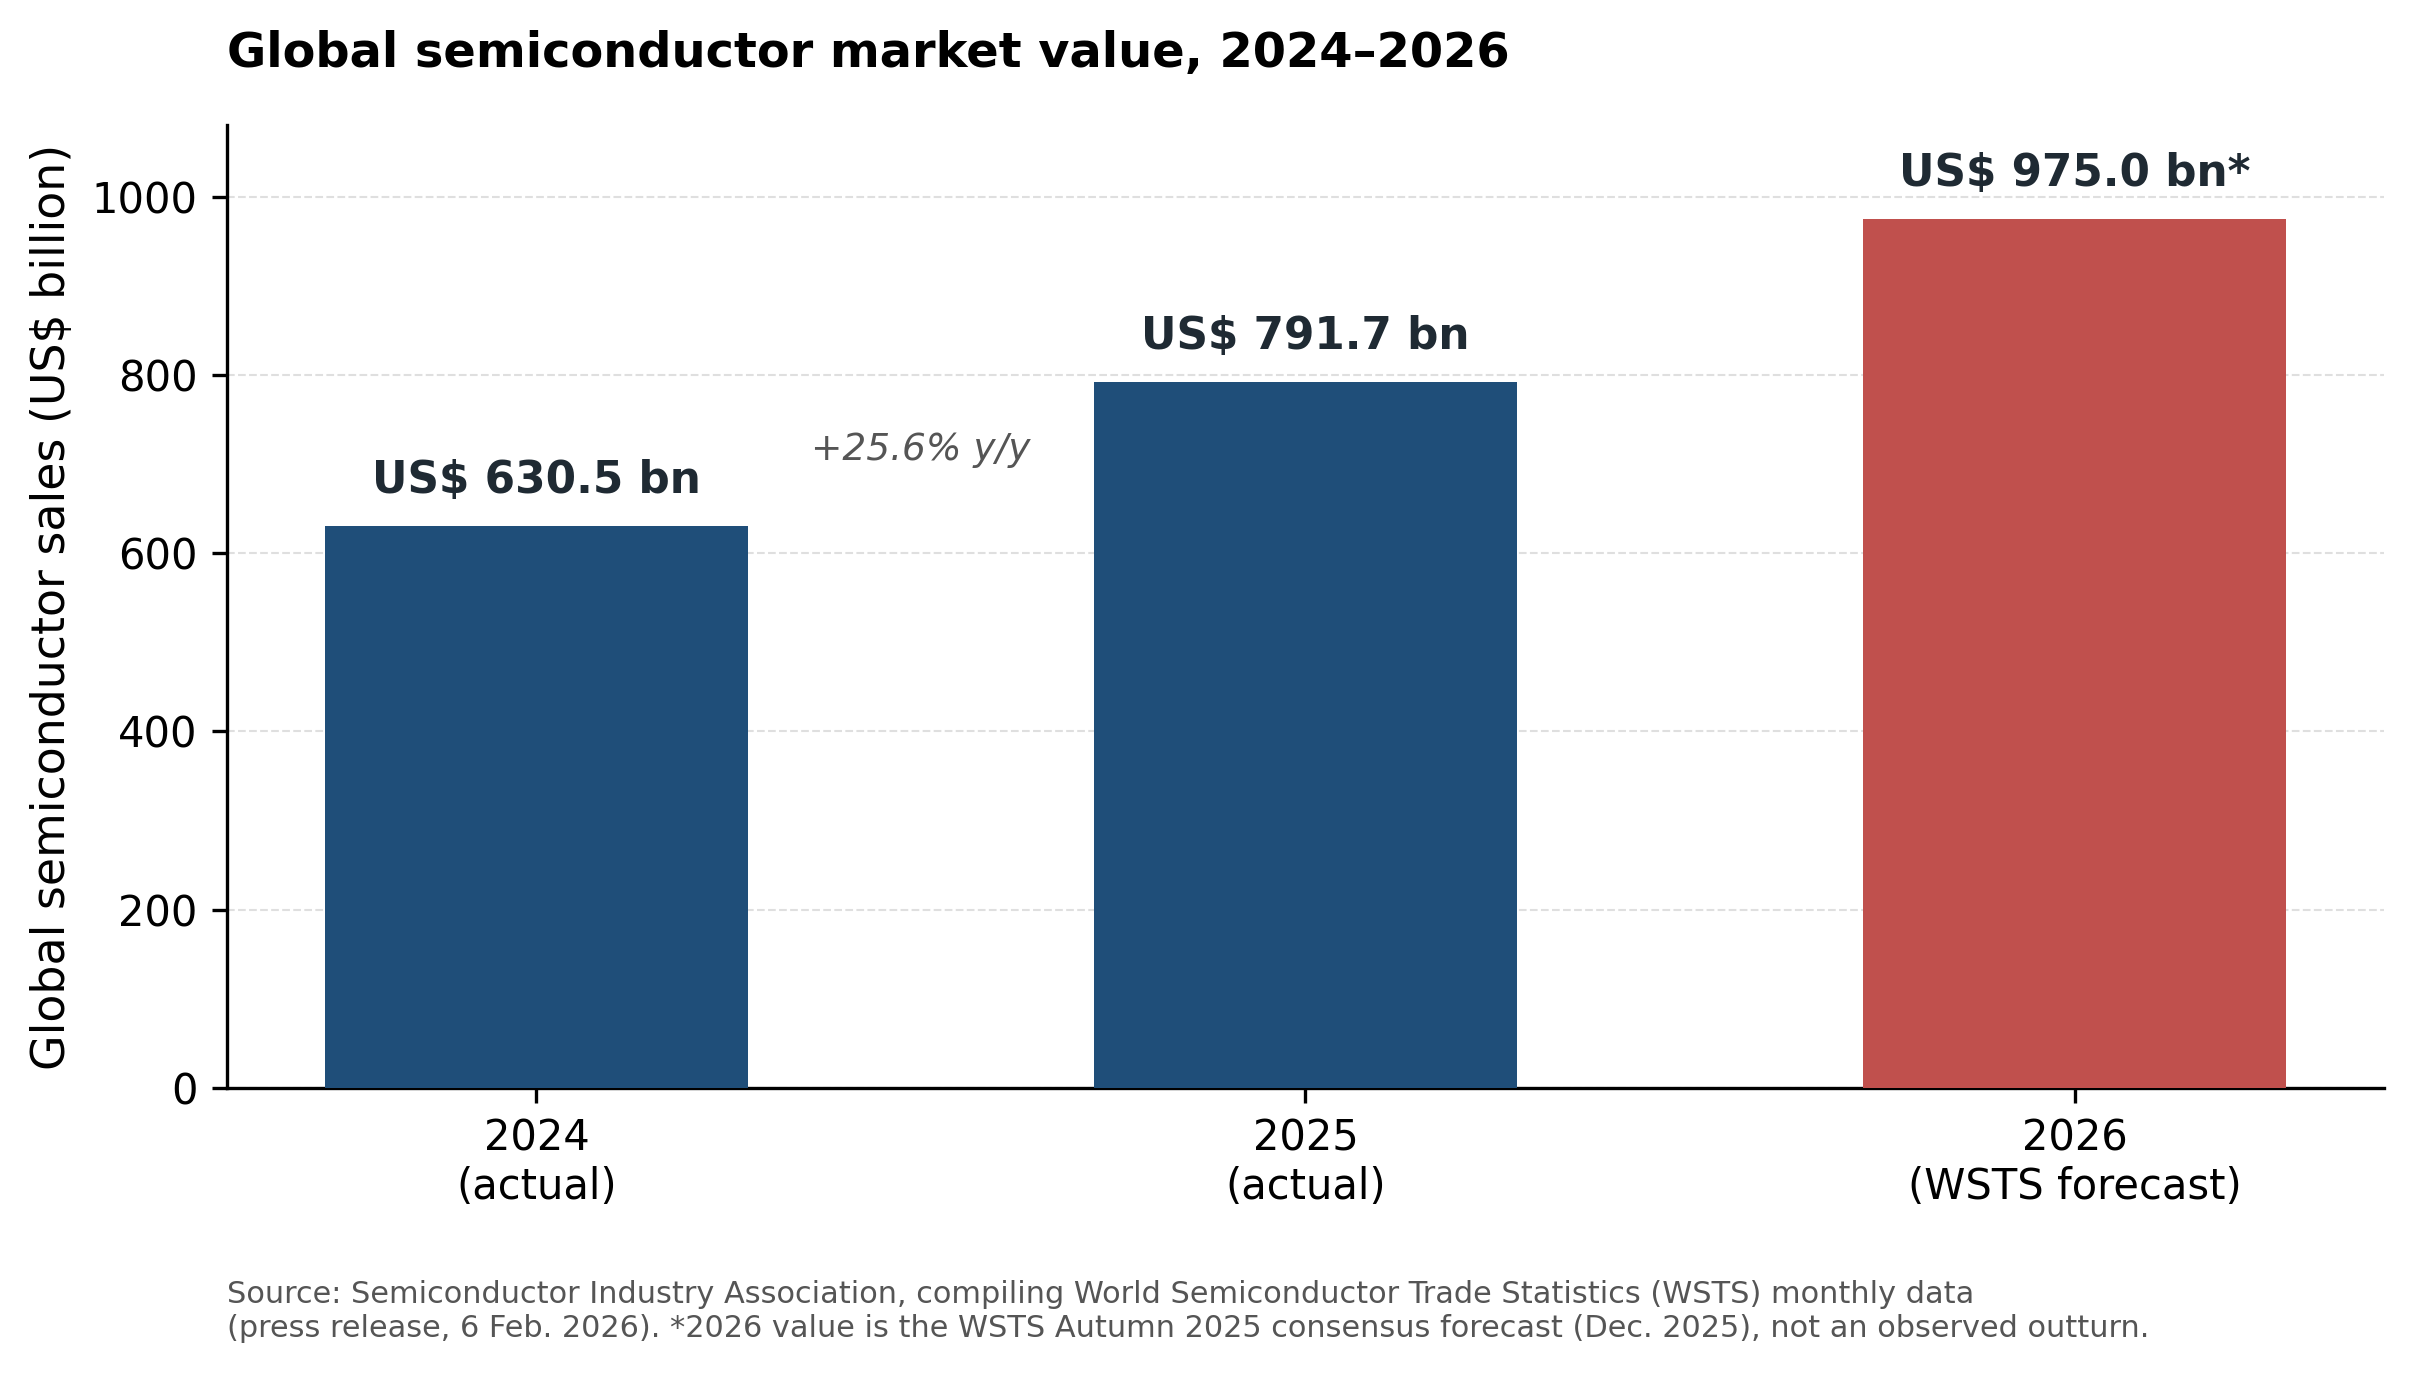
Source: Semiconductor Industry Association, compiling World Semiconductor Trade Statistics (WSTS) monthly data (press release, 6 Feb. 2026)⁷.
2026 value is the WSTS Autumn 2025 consensus forecast (Dec. 2025), not an observed outturn, and is marked accordingly.
Fabrication capacity for the most advanced process nodes, and for high-bandwidth memory specifically, remains concentrated in a small number of firms and jurisdictions, a concentration that recent industrial-organisation and international-relations scholarship attributes in part to deliberate "chokepoint" export-control policy rather than technological inevitability alone3. This concentration is the structural reason that even countries with substantial capability in upstream links of the chain — mining, metallurgy, electrical equipment — face a comparatively fixed, internationally supplied ceiling on the compute-hardware layer.
Testing the framework in Brazil
We now test the IBC framework's second prediction — that value capture tracks a country's conversion-stage position rather than its aggregate physical participation — against Brazil, selected for the evidentiary density of its 2025-vintage trade, mining, and regulatory data rather than for the direction of its expected result. We apply an explicit, author-constructed ordinal classification (Methods) to thirteen links of the chain, coding each as high domestic capability, partial capability, or critical import dependence, based on evidence of national production scale, engineering ownership, intellectual property, export capacity, and import dependence for critical components. This classification is a structuring judgement made transparent for scrutiny and revision, not a precisely measured index (Limitations).
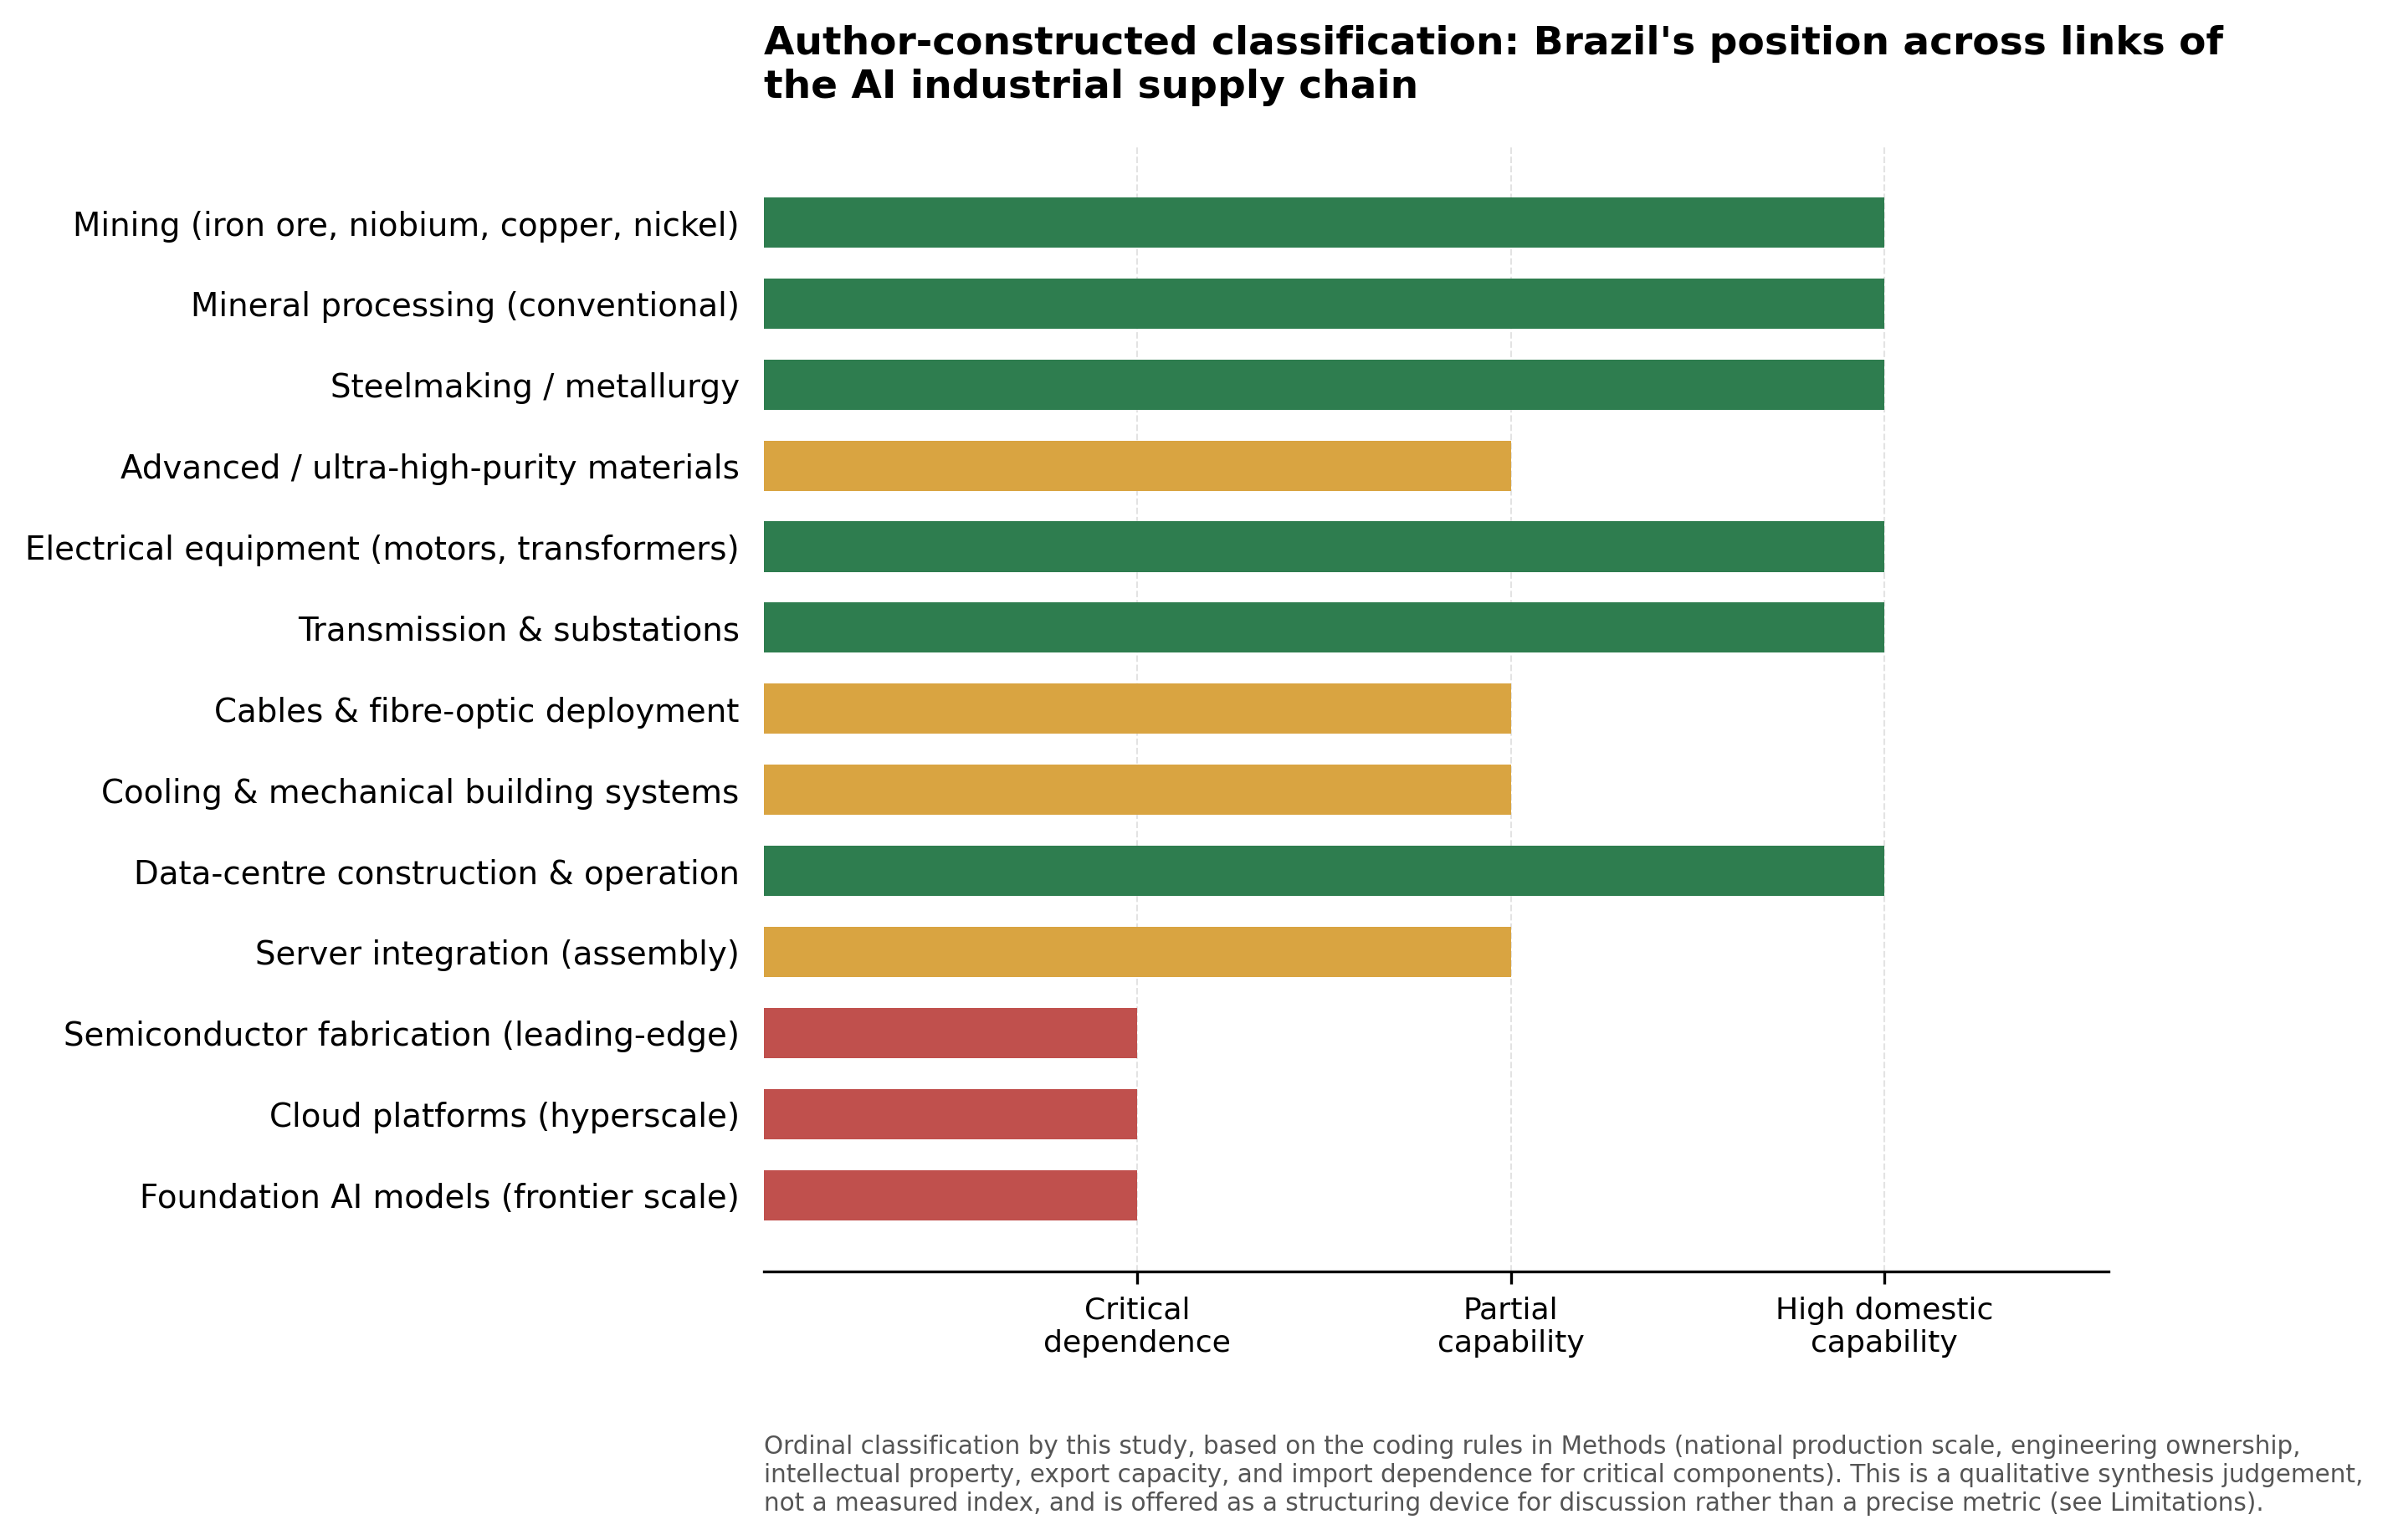
Ordinal classification by this study (see Methods for coding rules: national production scale, engineering ownership, IP, export capacity, import dependence for critical components).
Offered as a structuring device for discussion, not a precisely measured index; see Limitations for coding caveats and inter-rater considerations.
At the extraction end of the chain, Brazil's position is supported by audited corporate disclosure: Vale S.A. reports 2025 production of 336 million tonnes of iron ore (the highest level since 2018), and holds the #1 global position in iron-ore production alongside a #4 position in nickel and a #16 position in copper8,9. At the other end of the chain, Brazil hosts no leading-edge semiconductor fabrication and no domestically headquartered hyperscale cloud platform; national semiconductor-sector activity is concentrated in design, encapsulation, testing, and application-specific chips rather than frontier-node fabrication.
The physical/value asymmetry
The trade data available for 2024 illustrate this asymmetry, with an important caveat on comparability made explicit in the figure caption and in Methods. The Instituto Brasileiro de Mineração (IBRAM) reports full-year 2024 mineral export revenue of US$43.4 billion, of which iron ore accounted for 68.7% — approximately US$29.8 billion10. Over the first nine months of 2024 alone (not a full-year figure), Brazil's electronics and optical-equipment manufacturing sector — a customs category broader than semiconductors alone — recorded US$8.8 billion in imports compiled from official Comex Stat/SECEX/Ministério do Desenvolvimento, Indústria, Comércio e Serviços (MDIC) customs declarations11, with China supplying 52% of the total and semiconductor/integrated-circuit sub-categories (e.g., assembled memory modules) among the fastest-moving line items. Figure 5 presents both figures side by side as an illustrative, not a matched, comparison.
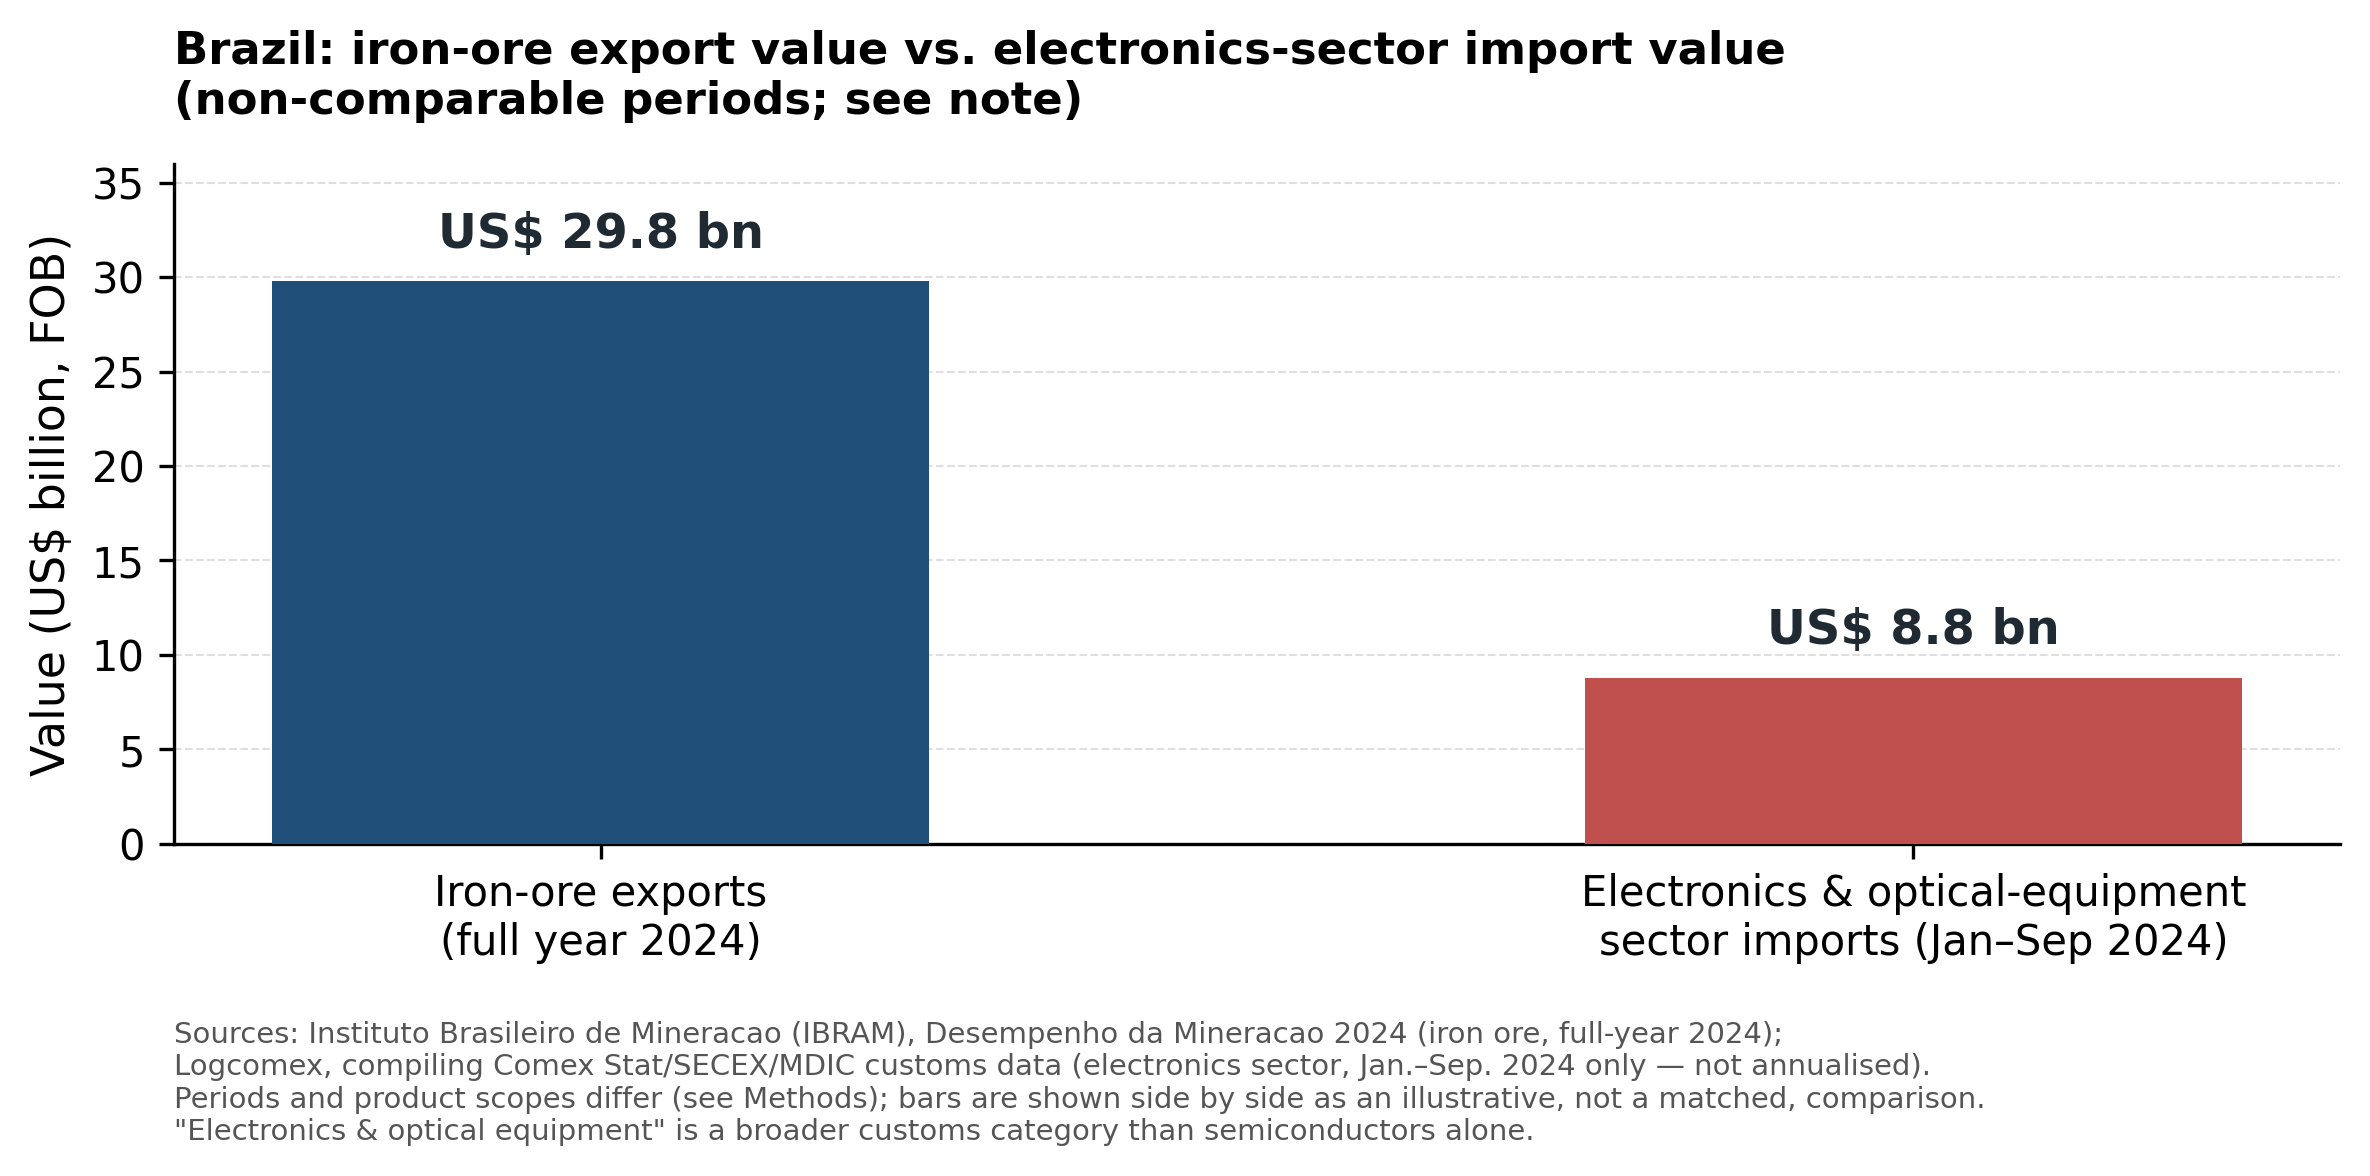
Sources: Instituto Brasileiro de Mineração (IBRAM), Desempenho da Mineração 2024¹⁰ (iron ore, full-year 2024); Logcomex, compiling Comex Stat/SECEX/MDIC customs data¹¹ (electronics sector, Jan.–Sep. 2024 only, not annualised).
Periods and product scopes differ (full year vs. nine months; a single commodity vs. a broad customs category including consumer electronics). Shown as an illustrative order-of-magnitude comparison, not a matched year-over-year balance.
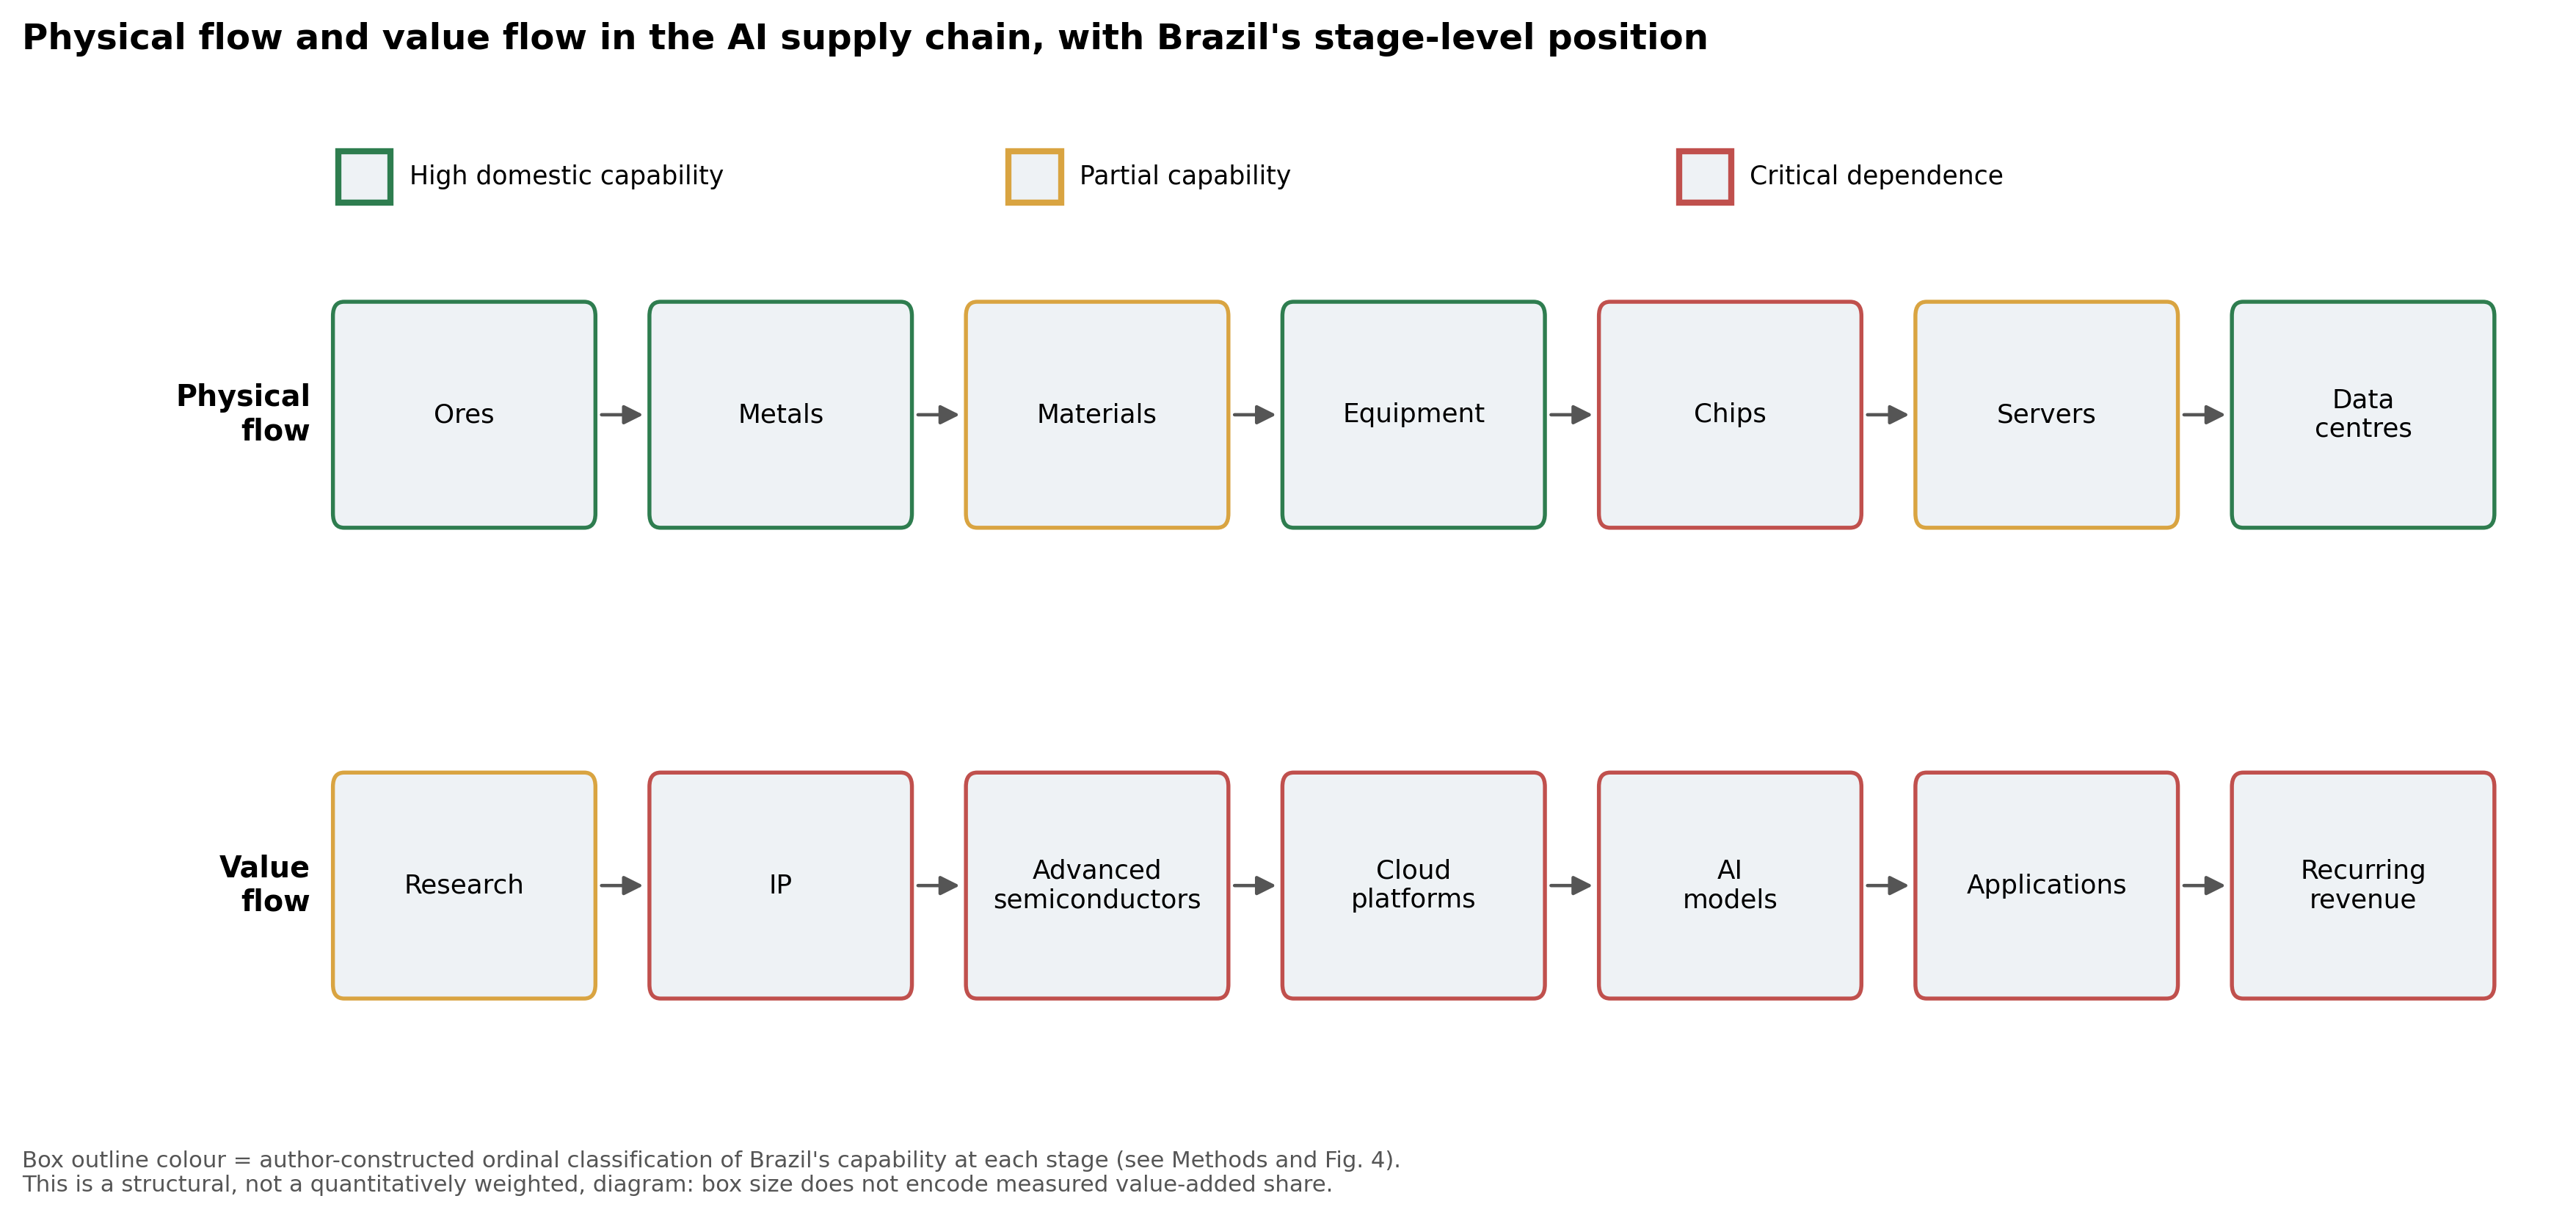
Box outline colour reproduces the author-constructed ordinal classification of Fig. 4 at each stage.
Structural diagram: box size does not encode a measured value-added share; see Methods for the qualitative distinction between the physical flow (inputs, mass) and the value flow (research, intellectual property, platform economics) developed in this Perspective.
Brazil's grid-connection bottleneck
Brazil's data-centre sector is expanding rapidly on the hosting side of the chain. The Empresa de Pesquisa Energética (EPE) reported that grid-connection requests filed by data-centre projects with the Ministério de Minas e Energia (MME) rose from 19.8 GW in September 2025 to 26.2 GW in November 2025 — a gain of 6.4 GW in roughly two months, following the September 2025 REDATA tax measure that reduced import tariffs on data-centre information-technology equipment12. This pipeline figure is at least an order of magnitude larger than the sector's estimated operating load of approximately 0.8 GW in 202513, indicating that the great majority of announced capacity is at the project-filing stage rather than built or contracted. In December 2025, Brazil's national grid operator (ONS) validated 7.3 GW of connection requests, of which 7.04 GW (38 projects) were data centres, concentrated in electrical corridors around Tamboré, Vinhedo, Hortolândia, and Campinas in São Paulo state that the sector press describes as operating near saturation14; the federal government responded with Decree No. 12,772/2025, replacing the prior first-come connection queue with a seasonal allocation model.
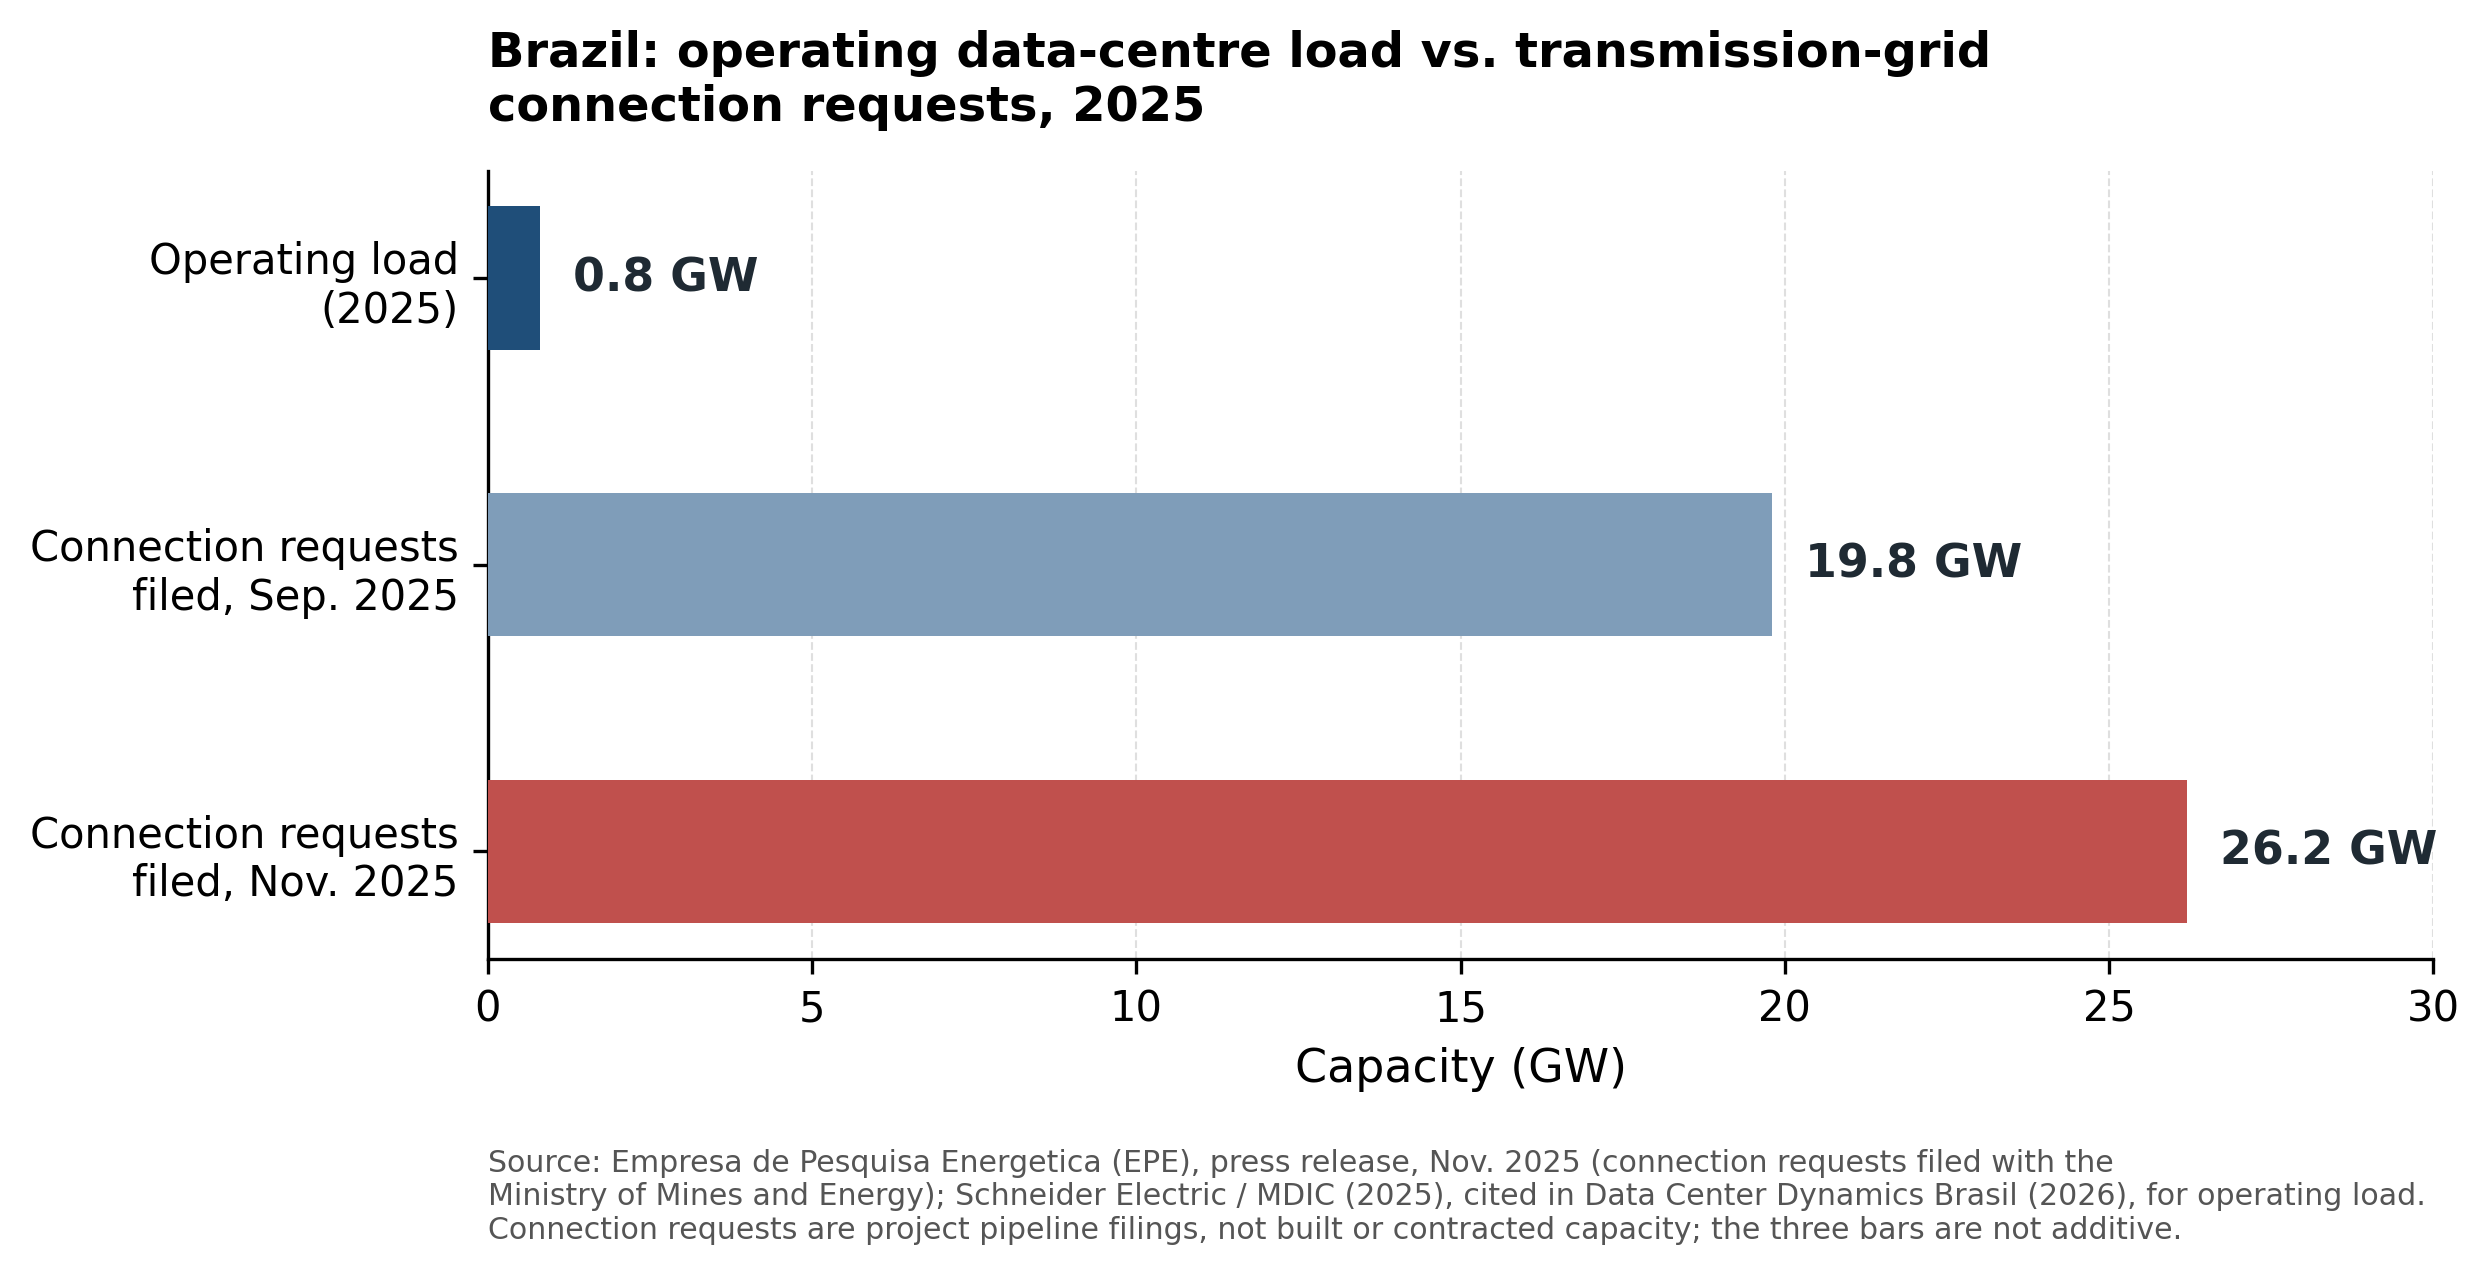
Source: Empresa de Pesquisa Energética (EPE), press release, Nov. 2025¹² (connection requests filed with the Ministry of Mines and Energy); Schneider Electric/MDIC (2025), cited in Data Center Dynamics Brasil (2026)¹³, for operating load.
Connection requests are project-pipeline filings, not built or contracted capacity; the three bars are not additive and should not be summed.
Brazil's electricity matrix closed 2024 with 88.2% renewable participation, according to the Balanço Energético Nacional 2025, published jointly by the Ministério de Minas e Energia and EPE15 — a structural advantage for hyperscale operators pursuing decarbonisation commitments, and a requirement formalised in the REDATA tax regime, which mandates fully renewable or clean-energy sourcing and a maximum water-use-effectiveness ratio for participating projects12. The distinction is analytically important: an annually balanced renewable share does not guarantee firm capacity available at the instant servers demand it, which is precisely the constraint generating the connection-queue congestion described above.
Discussion
Three findings from this synthesis bear on how the AI-infrastructure literature and the GVC/technological-dependency literature should be read together. First, the energy and semiconductor data reviewed here (Figs 2–3) confirm, with updated 2025–2026 figures, that the bottleneck identified in the AI-and-energy literature is not a transient artefact of the 2023–2024 demand surge: the IEA's most recent (Nov. 2025) update revised its 2030 projection upward rather than downward relative to its April 2025 report1,2, and semiconductor sales accelerated further in 2025 relative to 20247. This is consistent with the view that near-term AI scaling is increasingly supply-constrained by physical infrastructure rather than purely by model-development choices.
Second, the Brazilian case study offers evidence — not previously assembled with this combination of 2025-vintage sources, to our knowledge — that the reprimarisation pattern documented in the general Brazil–China and Brazil–GVC trade literature5,6 extends specifically into the AI-infrastructure buildout. Brazil supplies audited, world-leading volumes of the mineral inputs (iron ore, and via other producers not analysed in depth here, niobium and nickel) that ultimately enter steel, transformers, and cabling8,9, and is simultaneously host to one of the fastest-growing data-centre connection pipelines documented for any single country in 202512,13. Yet the ordinal classification in Fig. 4 shows this strength does not extend to leading-edge semiconductor fabrication, hyperscale cloud platforms, or frontier foundation models — the three links in Fig. 1 associated in the wider GVC literature with the highest intellectual-property intensity and recurring-revenue capture3. This is the same structural pattern — strong upstream/physical participation, weak downstream/IP participation — identified for Brazil's broader manufacturing trade with technologically advanced Asian economies5, now reproduced in a single, fast-moving sector.
Third, hosting physical AI infrastructure is not, on the evidence reviewed here, equivalent to capturing AI-related economic value, and the two should not be conflated in policy discussion. A data centre built with Brazilian steel, cabling, and transformers, connected to a predominantly renewable grid, and staffed by Brazilian engineering and construction firms can still run entirely on imported GPUs, memory, and networking silicon, and can still deliver its compute output through a foreign-owned cloud platform's billing and software stack. In this configuration, Brazil captures construction-phase and electricity-supply value while the recurring, scalable revenue stream associated with cloud subscription and AI-model usage accrues elsewhere. Whether Brazil's REDATA-style tax incentives and grid-access reforms12 are net positive for national value capture, or primarily accelerate a favourable-hosting/limited-value-capture equilibrium, is an empirical question outside the scope of this Perspective; it is one for which the connection-queue and semiconductor-import data assembled here provide a dated baseline for future evaluation.
We do not read this evidence as supporting an autarkic response. No country, including the United States, China, Taiwan, or South Korea, controls the entire chain in Fig. 1 domestically; the semiconductor-GVC literature is explicit that even the most advanced chip-manufacturing economies remain interdependent for equipment, materials, and design tools. The more precise question raised by our findings is which specific links — among power-electronics manufacturing, semiconductor packaging and testing, power-semiconductor design, edge computing, or Portuguese-language foundation models, for example — are simultaneously economically viable, technologically proximate to existing Brazilian capability (Fig. 4), and strategically consequential. Answering that question rigorously requires the fuller, protocol-driven evidence base described in Limitations, and is a natural next step for this research programme rather than a conclusion this Perspective can support on its own.
Brazil is one validation case, not the finding. What the evidence assembled here supports is the more general claim that the IBC framework was built to test: that AI capability is bounded less by algorithmic ambition than by the conversion-stage industrial base — transformers, fabrication capacity, critical minerals, grid connections — that no amount of model-architecture progress can substitute for on multi-year timescales. If this is right, the next phase of AI competition will increasingly depend on countries' ability to control energy, materials, and industrial infrastructure rather than compute architectures alone, and a country's standing in that competition will be set as much by its position in the conversion stage of Fig. 1 as by the models its firms are able to train.
Limitations
1. Evidentiary scope. This is a targeted, source-hierarchy-prioritised synthesis (Methods), not a pre-registered PRISMA systematic review. We did not query subscription academic databases (Web of Science, Scopus, IEEE Xplore) directly; peer-reviewed sources were identified via open web search and verified individually (title, authors, venue, and, where available, DOI) before citation. The reference list is accordingly shorter and less exhaustive than a full systematic review would produce, and the literature engaged with global value chains and critical minerals should be read as illustrative of an active research area rather than a comprehensive coverage of it.
2. Non-comparable trade figures. The iron-ore/electronics comparison in Fig. 5 combines a full-year (2024) commodity-export figure with a nine-month (Jan.–Sep. 2024) broad customs-category import figure. We present both explicitly labelled and un-annualised, but the comparison is illustrative of order of magnitude, not a matched trade-balance calculation, and should not be cited as a precise annual net-value figure for the AI-relevant component of Brazil's trade.
3. Ordinal classification, not a measured index. The chain-position classification in Fig. 4 and the flow diagram in Fig. 6 were constructed by the author using explicit coding criteria (Methods), but coding was performed by a single analyst without independent double-coding or inter-rater reliability testing. We specify concretely how this ordinal coding could be superseded: a composite conversion-stage index combining (i) domestic production share of conversion-stage output, (ii) import-dependence ratio for critical conversion-stage inputs, and (iii) time-to-scale for adding a marginal unit of conversion-stage capacity — each independently observable from trade and regulatory data — would let the present codes be checked, and where they diverge, revised, against a quantified benchmark. We report the ordinal classification now, rather than deferring publication for the index, because the underlying trade and regulatory data are time-sensitive; the classification should be read as a transparent, falsifiable starting hypothesis for structured expert-panel, Delphi, or composite-index validation, not as a finished quantitative index.
4. Pipeline vs. delivered capacity. Grid-connection request data (Fig. 7) measure regulatory filings, which are known in the Brazilian sector press to include speculative or duplicated project filings under the pre-Decree 12,772/2025 first-come queue; the 26.2 GW figure should be read as an upper-bound signal of investor interest, not as forecast built capacity.
5. Announced vs. executed investment. This Perspective does not compile firm-level AI-infrastructure capital-expenditure data for individual hyperscalers, because distinguishing announced, committed, and executed capital expenditure with consistent fiscal-year and currency treatment across companies requires a dedicated data-extraction exercise beyond the scope of a single Perspective; this is flagged in Methods as a priority extension rather than included with insufficiently verified figures.
6. Single-country case study. Findings on Brazil's chain position are not benchmarked quantitatively against other resource-rich middle-income economies in this Perspective; such a comparison (e.g., Chile, Indonesia, South Africa) would require a harmonised cross-country dataset that does not yet exist in a directly comparable form and is a natural extension of this research programme.
7. Rapid obsolescence. Several of the figures reported here (grid-connection queues, semiconductor sales, REDATA regulatory provisions) describe a fast-moving policy and market environment as of late 2025/early 2026; readers should treat point estimates as dated observations rather than stable structural parameters.
8. Use of AI tools. Large language model (Claude, Anthropic) assistance was used for literature search triage, drafting, and figure-code generation, under human direction and verification at every stage described in Methods; all quantitative claims were traced to primary or institutional sources before inclusion, and no reference, statistic, or quotation in this manuscript was generated without verification against a retrievable source.
Methods
Study design and scope
This is a Perspective article combining (i) the construction of a general framework, the Industrial Bottleneck Cascade, from a narrative synthesis of institutional statistics on the physical, energy, and materials base of global AI infrastructure, and (ii) an evidence-based test of that framework's predictions against Brazil's position in the chain. We explicitly do not classify this work as a systematic review: no protocol was pre-registered, no multi-database systematic search with duplicate-removal and dual-screening was executed, and the search was not restricted to a fixed date window with a reproducible PRISMA flow diagram. Where the source material for this project (an internally developed research protocol) called for full systematic-review apparatus, we substituted a smaller-scope, transparently labelled targeted synthesis appropriate to a single-session Perspective, and flag this substitution to the reader as a deliberate scope decision rather than an oversight.
Evidence sourcing and hierarchy
Quantitative claims were sourced, in descending order of preference, from: (i) primary institutional statistical releases (International Energy Agency; Empresa de Pesquisa Energética; Ministério de Minas e Energia; Instituto Brasileiro de Mineração; Semiconductor Industry Association/World Semiconductor Trade Statistics); (ii) audited or regulatory corporate disclosures (U.S. Securities and Exchange Commission filings; investor-relations presentations cross-checked against filings); (iii) customs-data aggregators compiling official government trade statistics (Comex Stat/SECEX/MDIC, via Logcomex); and (iv) peer-reviewed journal articles identified through open web search and individually verified for author names, journal, year, volume, and DOI before citation. Sector or financial press was used only to locate primary sources, not as a stand-alone evidentiary basis for quantitative claims; every figure reported in Results was traced to and cited from the underlying institutional or corporate source, not the press article that first reported it, wherever the primary source could be independently located. All web-sourced material was accessed in the course of manuscript preparation; source URLs are listed in References.
Classifying Brazil's chain position
Thirteen chain links were coded on a three-point ordinal scale — high domestic capability (3), partial capability (2), critical import dependence (1) — using the following criteria, adapted from the classification framework outlined in the source research protocol underlying this study: (a) evidence of national production at commercially relevant scale; (b) evidence of domestically owned engineering or process design, as distinct from local assembly of foreign-designed systems; (c) identifiable domestic intellectual property or patent activity in the link; (d) demonstrated export capacity in the link; and (e) the degree of dependence on imported components for the link's core function. A link was coded 3 only where multiple criteria were satisfied with reference to an identifiable source (e.g., audited production data for mining and metallurgy); a link was coded 1 where core-function components have no commercially relevant domestic production (e.g., leading-edge semiconductor fabrication, hyperscale cloud infrastructure, frontier foundation models). Coding was performed by the author (single-analyst coding; see Limitations) and is reported with the underlying reasoning inline in Results so that it can be contested and revised.
Figure construction
Quantitative figures (Figs 2, 3, 5, 7) were generated in Python 3.10 using Matplotlib 3.10, directly from the cited data points; source values, units, and citations are reproduced in each figure caption and in the corresponding data table in Supplementary Information. No figure interpolates, smooths, or extrapolates beyond the cited source's own stated values, with the single exception of the 2020 and 2022 interpolated points in Fig. 2, which are explicitly marked as such in the caption and excluded from any quantitative claim in the main text. Structural diagrams (Figs 1, 4, 6) were generated in Matplotlib as schematic devices and are labelled in their captions as non-quantitative or ordinal-classification outputs, consistent with the distinction required throughout this Perspective between measured data and author-constructed structuring judgements.
Use of AI assistance
A large language model (Claude, Anthropic) was used, under continuous human direction, for: (i) triage and initial retrieval of candidate sources via web search; (ii) drafting of prose subject to human review and revision at every stage; (iii) generation of figure-plotting code executed and visually inspected by the human author before inclusion. The model did not independently select which sources to cite as authoritative, did not generate any statistic without a traceable source, and did not draft the Limitations or Methods disclosures without them being reviewed against this principle. This disclosure follows the AI-transparency practice recommended in the source research protocol underlying this study.
Data availability
All data reported in this Perspective are drawn from publicly accessible institutional, regulatory, and corporate-disclosure sources cited in References; no restricted or proprietary dataset was used. A consolidated CSV of the figure-level data points, with source URLs and access dates, is provided in Supplementary Data File 1 (accompanying this submission).
Code availability
The Python/Matplotlib scripts used to generate Figures 1–7 are provided in Supplementary Code File 1 and will be deposited, on acceptance, in a version-controlled public repository with a citable DOI.
Competing interests
The author declares no competing interests.
Author contributions
T.A.V. conceived the study, conducted the evidence synthesis, constructed the classification framework and figures, and wrote the manuscript.
References
1. International Energy Agency. Energy and AI (IEA, Paris, 2025); https://www.iea.org/reports/energy-and-ai
2. International Energy Agency. Key Questions on Energy and AI, updated Nov. 2025 (IEA, Paris, 2025); https://www.iea.org/reports/key-questions-on-energy-and-ai
3. Wong, C.-Y., Yeung, H. W.-C., Huang, S., Song, J. & Lee, K. Geopolitics and the changing landscape of global value chains and competition in the global semiconductor industry: rivalry and catch-up in chip manufacturing in East Asia. Technol. Forecast. Soc. Change 209, 123749 (2024); https://doi.org/10.1016/j.techfore.2024.123749
4. Hidalgo, C. A., Klinger, B., Barabási, A.-L. & Hausmann, R. The product space conditions the development of nations. Science 317, 482–487 (2007); https://doi.org/10.1126/science.1144581
5. Instituto de Estudos para o Desenvolvimento Industrial (IEDI). Letter IEDI n. 1292 — Brazil-China trade and the loss of Brazilian economic complexity (IEDI, São Paulo, 2025); https://www.iedi.org.br/artigos/textos/english/letter_iedi_n_1292.html
6. Rêgo, B. et al. (Network Ideas / IDEAs). Structural economic problems and polarization in contemporary politics in Brazil (2026); https://www.networkideas.org/2026/04/28/structural-economic-problems-and-polarization-in-contemporary-politics-in-brazil/
7. Semiconductor Industry Association. Global Annual Semiconductor Sales Increase 25.6% to $791.7 Billion in 2025. Press release, 6 Feb. 2026 (compiling World Semiconductor Trade Statistics data); https://www.semiconductors.org/global-annual-semiconductor-sales-increase-25-6-to-791-7-billion-in-2025/
8. Vale S.A. Form 6-K, financial year 2025 (U.S. Securities and Exchange Commission, filed 2025); https://www.sec.gov/Archives/edgar/data/917851/000129281425003613/vale20251023_6k.htm
9. Vale S.A. Investor presentation summary, 2025 production and market position (Quartr, accessed 2026); https://quartr.com/events/vale-s-a-vale3-investor-presentation_3s4UZwnv
10. Instituto Brasileiro de Mineração (IBRAM). Desempenho da Mineração 2024 (IBRAM, Brasília, 2025); https://www.ibram.org.br/noticia/desempenho_da_mineracao_2024/
11. Logcomex. Importação de eletrônicos: análise e recomendações estratégicas. Logcomex Insights (2025), compiling Comex Stat/SECEX/Ministério do Desenvolvimento, Indústria, Comércio e Serviços (MDIC) customs data; https://insights.logcomex.com/reports/importacao-de-eletronicos-analise-e-recomendacoes-estrategicas/
12. Empresa de Pesquisa Energética (EPE). REDATA: EPE acelera planejamento da rede para suportar crescimento recorde de Data Centers. Press release, Nov. 2025 (EPE, Brasília); https://www.epe.gov.br/pt/imprensa/noticias/redata-epe-acelera-planejamento-da-rede-para-suportar-crescimento-recorde-de-data-centers
13. Data Center Dynamics Brasil. Data centers no Brasil: por que a disputa agora é por energia, conexão e engenharia (2026), citing Schneider Electric/Ministério do Desenvolvimento, Indústria, Comércio e Serviços (MDIC), Novas perspectivas sobre os caminhos do Brasil para o crescimento industrial e descarbonização (2025); https://www.datacenterdynamics.com/br/opini%C3%B5es/data-centers-no-brasil-por-que-a-disputa-agora-%C3%A9-por-energia-conex%C3%A3o-e-engenharia/
14. Revista Mundo Elétrico. Data centers no Brasil: por que a disputa agora é por energia, conexão e engenharia (2026), citing Operador Nacional do Sistema Elétrico (ONS) connection-request validation data, Dec. 2025; https://www.revistamundoeletrico.com.br/artigos-tecnicos/data-centers-no-brasil-por-que-a-disputa-agora-e-por-energia-conexao-e-engenharia/
15. Ministério de Minas e Energia & Empresa de Pesquisa Energética (EPE). Balanço Energético Nacional 2025 (MME/EPE, Brasília, 2025).
16. S&P Global Commodity Insights. Global data center power demand to double by 2030 on AI surge: IEA (10 Apr. 2025), synthesising IEA data cited in Ref. 1; https://www.spglobal.com/energy/en/news-research/latest-news/electric-power/041025-global-data-center-power-demand-to-double-by-2030-on-ai-surge-iea
17. Evans, S. Carbon Brief. AI: Five charts that put data-centre energy use — and emissions — into context (2025), synthesising IEA data cited in Ref. 1; https://www.carbonbrief.org/ai-five-charts-that-put-data-centre-energy-use-and-emissions-into-context
images/ folder. Search the HTML source for “FIGURA” to locate each image block.